
Study on the Execution of Industrial Engineering Tools in Apparel Industry
Kazi Forhad Hossain1, Md. Hannan Mia & Rajan Mia
Department of Textile Engineering
Northern University Bangladesh
Email: [email protected]1
Abstract
Productivity isn’t everything, but in the long run it is almost everything. Differences in GDP growth across countries are largely due to differences in productivity growth. In Bangladesh labor productivity is lower than that of many other competitor countries. But the low labor cost is the primary factor that makes Bangladesh a place for outsourcing the production of RMG products. However, low productivity is the main limitation for the garments industry in Bangladesh. As such, implementation of industrial engineering tools and techniques is essential to increase productivity in apparel industry.
Elimination of global textile and apparel trade quotas on January 1, 2005 has brought a dramatic shift in the world market of textile and apparel products. The apparel industry faces a great competition among different countries. The key factors of the competition are the Cost, Quality and Lead Time. In the context of fierce global market competition, product prices are declining and Buyers are demanding shorter Lead Times with good Quality. A number of measures should be undertaken to substantially improve productivity.
CHAPTER-01
INTRODUCTION
1.1 Introduction:
Garment industry is one of the major industries of the world. The production process of garments is separated into four main phases: designing, garment pattern making, fabric spreading & cutting, sewing and ironing & packing. The most critical phase is sewing phase [1]. As the sewing is the heart of apparel industry, we have to design the sewing line properly so as to achieve the best output at maximum efficiency. Apparel is a mass production system. Assembly line production systems are developed to meet the requirement of mankind, which continue to grow day by day [2]. The demand for greater product variability and shorter life cycles has caused traditional production methods to be replaced with assembly lines [3]. Assembly line is an industrial arrangement of machines, equipment’s and workers for continuous flow of work prices in partitioning the total amount of work into a set of elementary operations called tasks [4]. Tasks are assigned to operators depending on constrains of different labor skill levels. Finally, several workstations in sequence are formed as a sewing line. The sewing process includes a set of work stations, at each of which a specific task is carried out in a restricted sequence, write hundreds of employees and thousands of bundles of sub- assemblies producing different style simultaneously. Therefore this process is of cortical importance and needs to be planned more carefully. As a consequence, good line balancing with small stocks in the sewing line has to be drawn up to increase the efficiency and quality. So the aim of assembly line balancing in sewing line is to assign tasks to the workstations, so that the machines of the workstation can perform the assigned task with a balanced loading with different labor skill levels [5].
1.2 Objectives:
- To analyze break down of operation.
- To Time study & Method study of different garments.
- To Sam & SMV calculation of different garments.
- To set target production Lower cost.
- To increase the productivity by line balancing.
- Increase profitability.
- To reduce rework and wastage from sewing section.
- To reduce production cost of garment manufacturing.
- To improve the productivity and efficiency of the factory.
- To create layout for sewing lines which include knit line.
- To study the bottlenecks for the line.
- To know about operator efficiency, line efficiency, target, SMV, cycle time for the lines.
CHAPTER-02
LITERATURE REVIEW
2.1 Line Balancing:
Line Balancing is leveling of the workload across all operations in a line to remove bottlenecks and excess capacity, defined by Six Sigma Material. When you consider mass production, garments are produced in lines or set of machines instead of single machine. A line may be assembly line, modular line or section, a line set with online finishing and packing. A line includes multiple work stations with varied work contents. Production per hour is varied depending on work content (standard minutes of particular task/operation), allocation of total manpower to a particular operation, operator skill level and machine capacity. Operation with lowest production per hour is called as bottleneck.
A bottleneck operation in a line determines the output of the line. That is why it is very important to increase production of the bottleneck processes or operations. Line supervisors, work study officers find ways to increase production from the bottleneck operation and implement those means one by one to level work across operations.
Secondly Line balancing is essential as because, if excess capacity of sewing operation does not utilized production cost will be high and results in waiting and absorption of fixed cost.
Though above definition is widely accepted, wear saw few factories where so called Engineers name line balancing to something else. At the time of machine/manpower planning based on work content of each operations, they prepare a sheet where operation wise manpower is calculated. Most of the cases calculated manpower gives fraction of figure but in real you can’t allocate to fraction of manpower to an operation. So manpower planner decides to which operations one machinist, to which operations two machinist or where only single machinist will be allocated for two or three operations. Planner makes this decision based on calculated data.
In the following Figure, production per hour of two lines has been shown. Following Line chart indicates that Line B is better balanced than Line A.

Line Balancing is leveling the workload across all processes in a cell or value stream to remove bottlenecks and excess capacity. A constraint slows the process down and results if waiting for downstream operations and excess capacity results in waiting and absorption of fixed cost.

It is the allocation of sewing machine, according to style and design of the garments. It depends on what types of garments we have to produce. It is done to increasing productivity.
When you consider mass production, garments are produced in lines or set of machines instead of single machine. A line may be assembly line, modular line or section, a line set with online finishing and packing. A line includes multiple work stations with varied work contents. Production per hour is varied depending on work content (standard minutes of particular task/operation), allocation of total manpower to a particular operation, operator skill level and machine capacity. Operation with lowest production per hour is called as bottleneck operation for that line[6].
2.2 Objectives of Line Balancing:
Match the production rate after all wastes have been removed to the talk time at each process of the value stream.
- Regular material flow.
- Maximum uses of man power and machine capacity.
- Minimum process time.
- Minimizing slack time.
- Minimizing workstation.
- Maximum output at the desired time.
- Quality maintenance of the garment.
- Reduce production cost.
2.3 Importance of Line Balancing:
- Line balancing helps to know about new machine required for new style.
- It becomes easier to distribute particular job to each operator.
- It becomes possible to deliver goods at right time at the agreed quality for list cost.
- Good line balancing increase the rate of production.
- Line balancing helps to compare the required machinery with the existing one and compare balance.
- It also helps in the determination of labor requirement.
- Good balancing reduces production time.
- Profit of a factory can be ensured by proper line balancing.
- Proper line balancing ensured optimum production at the agreed quality.
2.4 Goals for balancing:
There are many goals [7] of line balancing they are given below
- Meeting production schedule.
- Avoiding the waiting time.
- Minimizing overtime.
- Protecting operator earning.
2.5 Process to balance the time:
The balancing of the time is necessary to balance the line, so the process [7] of balancing the time is to be followed as given in the points here.
- Knowing work available at the start of the day.
- Planning transfer needed to compensate for any know absenteeism.
- Checking attendance at the start of the day.
- Making additional assignments to compensate unexpected absentees.
- Making periodic checks during the day to check production.
2.6 Points to be noted when making balancing:
- Meeting production target by usage of
- Regular operators,
- Utility operators,
- Shuttle operators.
- Work flow should be constant throughout all operations.
- Avoiding overtime.
- Determining human resource.
- Checking absence daily.
- Updating daily production every two hours.
2.7 Process to start balancing the production line:
- Allocating operators based on the planned efficiency.
- Determining the amount of work in process required to ensuring smooth flow.
2.8 Steps to balance the line:
The method of line balancing can vary from factory to factory and depends on the garments manufactured; but at any instance, line balancing concerns itself with two distinct applications.
2.9 Opening the line:
Opening the line means the operations that are done to obtain a basic of the line or the collection or establishment of a semi balanced line before final balancing. The processes of opening the line are given here.
- Calculation of labor requirements.
- Operation breakdown.
- Opening the line Theoretical operation balance.
- Initial balance.
- Balance control.
2.10. Operating the line:
Operating the line means the successful running of the line to always keep the balance in progress of the production.
Opening the line and operating the line is significant steps to balance the line for any further production in a single or multiple production lines. Though it varies from different production system the application signifies to balance properly.
2.11 Work-study:
Work study is the systematic examination of the method of carrying activities, so as to input the effective use of resources and to setup standards and performance for the activities being carried out. Management frequently all’s on specialist to assist it in improving productivity. One of the most powerful tools they can use is that of Work- Study.
2.12 Father of work-study:
Mr. FW (Frederic Winslow) Taylor who is called the father of scientific management is the founder of work-study. During the Second World War USA needed so many arms within a short time. Then Mr. FW Taylor applied Work-Study method to make many arms in short time & go tremendous result. After that work-study is being used in everywhere. Now it‘s circumference is getting larger day by day.
2.13 History of work study in Bangladesh:
Activities of work study in textile and apparel industry are done by industrial engineering department. Actually work study is used for measuring work. Industrial engineering department is responsible for work study in the garment industry. Work study is the most important tool for controlling production and improving productivity. It is a new concept in textile and apparel industry. We can define work study in the following way.
Work study is the investigation of the work done in an organization by means of a consistent system in order to attain the best utilization of men, machines and materials at a period of time.
According to ILO, Work study is used to embrace the techniques of method study and work measurements which are employed to ensure the best possible use of human and available resources in carrying out a specified activity.
Mr. Keith Harding form England [9] started Work-Study in Bangladesh (Young one Corporation) in 1991. Now it is contributing very well to increase the productivity in Bangladesh.
2.14 Components of Work Study:

2.15 Characteristic of work study engineer:
A work study engineer need to be educated, expert, smart, confident, personal dignity and honest. Details below-
2.15.1 Sincerity and Honest:
The work study person must be sincere and honest only if is the case will he / she gains the confidence and respect of those with whom he or she will work.
2.15.2 Enthusiasm:
He /she must be really keen on the job, believe in the importance of what he or she is doing and be able to transmit enthusiasm to the people round about.
2.15.3 Tact/ Diplomacy:
Tact is dealing with people comes from understanding them and wishing to hurt their feeling by unkind or thoughtless word, even when these may be justified. Without justified no work study person is going to get very far.
2.15.4 Good Appearance:
The person must be neat tidy & look efficient. This will inspire confidence among the people with whom he or she has to work.
2.15.5 Self-Confidence:
This can only come with good training and experience of applying work study successfully. The work study practitioner must be able to stand up to top management, supervisors or workers in defense of his opinion and finding, and to do so in such a way that will respect and not give offence.
2.16 Calculate SAM & SMV of a Garment:
SAM and SMV are units of measuring standard minutes of a task or an operation of a garment. Where, SAM stands for Standard Allowed Minutes and SMV stands for Standard Minute Value.
When someone says sewing SMV of garment is 15 minutes, it means that particular garment should take 15 minute to complete sewing task by a standard worker. Garment SMV is summation of SMV of number of operations those are performed to make the garment.
2.17 Method of Calculating SMV:
- Calculation of SMV Using Synthetic Data
- Calculation of SMV through Time Study
2.17.1 Calculation of SMV Using Synthetic Data:
In this method ‘Predetermined Time Standard’ (PTS) code are used to establish ‘Standard Time’ of a garment or other sewing products.
Step 1: Select one operation for which you want to calculate SMV.
Step2: Study the motions of that operation. Stand by side of an operator (experienced one) and see the operator how he is doing it. Note all movement used by the operator in doing one complete cycle of work. See carefully again and recheck your note if all movement/motion are captured and correct. (For example motions are like – pick up parts one hand or two hands, align part on table or machine foot, realign plies, etc.)
Step 3: List down all motion sequentially. Refer the synthetic data for TMU (Time measuring unit) values. For synthetic data you can refer GSD (without license use of GSD code prohibited but for personal use and study one can refer GSD code and TMU values) or Sewing Performance Data table (SPD). Now you got TMU value for one operation (for example say it is 400 TMU). Convert total TMU into minutes (1 TMU=0.0006 minute). This is called as Basic Time in minutes. In this example it is 0.24 minutes.
Step 4: Standard minutes value (SMV) = (Basic minute + Bundle allowances + machine and personal allowances). Add bundle allowances (10%) and machine and personal allowance (20%) to basic time. Now you got Standard Minute value SMV.
SMV = (0.24+0.024+0.048) = 0.31 minutes.
2.17.2 Calculation of SMV through Time Study:
Formula:
- SMV = Basic time +Allowance
- Basic time = Cycle Time X performance Rating
Terms:
Basic Time: Basic time is the required time a qualified operator to complete a job when he /she works at standard performance (at 100% rating)
Observed Time: Time required by a qualified work study officer by observing a regular worker while he/she doing a task.
Rating: Rating is the assessment of a worker rate of working relative to observer’s concept of the rate corresponding to standard pace. Rating depends on skill, speed, effort & dexterity of the operator.
Standard rating: The standard rate is the qualified workers are assumed to be able to work provided they are motivated to do the job & if right method of work is applied such rate is called as standard rating. This standard rate correct to 100 in the rating scale.
2.18 Procedure of SMV calculation through time study:
Step 1: Select one operation for which you want to calculate SMV.
Step 2: Take one stop watch. Stand by side of the operator. Capture cycle time for that operation. (cycle time – total time taken to do all works needed to complete one operation, i.e. time from pick up part of first piece to next pick up of the next piece). Do time study for consecutive five cycles. Discard if found abnormal time in any cycle. Calculate average of the 5 cycles. Time you got from time study is called cycle time. To convert this cycle time into basic time you have to multiply cycle time with operator performance rating. [Basic Time = Cycle Time X performance Rating]
Step 3: Performance rating. Now you have to rate the operator at what performance level he was doing the job seeing his movement and work speed. Suppose that operator performance rating is 80%. Suppose cycle time is 0.60 minutes.
Basic time = (Cycle time X rating) = (0.60 X 80%) = 0.48 minutes.
2.19 Calculate efficiency of a production batch or line:
Like individual operator efficiency, efficiency of a production line or batch or section is important for a factory. Daily line efficiency shows the line performance. To calculate efficiency of a line for a day, you will need following data (information) from the line supervisor or line recorder.
- Number of operator-how many operators worked in the line in a day.
- Working hours (Regular and overtime hours)-how many hours each of the operators worked or how many hours the line run in a day.
- Production in pieces-how many pieces are produced or total line output at the end of the day.
- Garment SAM-what is exact standard minute of the style (garment).
Once we have above data we have to calculate following using above information
- Total minutes produced by the line: To get total produced minutes multiply number of operators by daily working hours.
2.20 Calculate Operator Worker Efficiency:
In apparel manufacturing, skill and expertise of a sewing operator is being presented in “Efficiency” term. An operator with higher efficiency produces more garments than an operator with lower efficiency in the same time frame. When operators work with higher efficiency, manufacturing cost of the factory goes down.
Secondly, factory capacity is estimated according to the operator efficiency or line efficiency. Hence, efficiency is one of the mostly used performance measuring tools. So how do you calculate operator efficiency in factory? To calculate operator efficiency we will be needed standard minutes (SAM) of the garment an operations our operator is making. Use following formula and calculate operator efficiency.
2.21 Efficiency calculation formula:
Efficiency % = [( production x SMV)/ (Manpower x Working Hour)] x 100
2.22 Productivity:
The definition of productivity is given as “OUTPUT” compared to “INPUT”. According to Marsh, Brush (2002) in his article Journal of industrial technology, productivity is a measure of the efficiency and effectiveness to which organizational resources (inputs) are utilized for the creation of products and/ or services (outputs). Productivity measurement is both a measure of input utilization and an assessment as to whether or not input utilization is growing faster than output.
In the case of a garment manufacturing factory, “output” can be taken as the number of products manufactured, whilst “input” is the people, machinery and factory resources required to create those products within a given time frame. The key to cost effective improvements in output- in “productivity”- is to ensure that the relationship between input and output if it comes only as a major increase in input. Indeed, in an ideal situation, “input” should be controlled and minimized whilst “output” is maximized.
Higher productivity provides more products from the same number of people, in the same time frame. This in turn improves “overhead recovery” related to factory costs, such as electricity and fuel, because overheads are fixed within that frame. So, the more products produced in a given time frame the less overhead allocation per product, which, in turn reduces the cost of each individual item and therefore improves competitive edge.
Dr. Chiloe jenny in his book “managing Productivity in the Apparels Industry” explained the different ways of measuring productivity. Productivity can be expressed in many ways but mostly productivity is measured as lab our productivity, machine productivity or value productivity. These three terms can be defined as-
- Lab our productivity – Output per labor (direct + indirect) in a given time frame (in pieces).
- Machine productivity – Output per machine in a given time frame (in pieces).
- Value productivity – Total value of output in a given time frame.
CHAPTER-03
METHODOLOGY
3.1 Methodology:
For this experiment one garment (t-shirt) has been chosen. After that time & method study is conducted according to the process sequences. Then find out the flaws in the system which reduces the productivity. Then those processes are improved by replacing higher efficient worker, improving the method and installing higher speed machine. After that, time study is again conducted to see the difference between before and after SMV to check that the productivity of different garments have been improved or not. Work measurement can be defined as the implementation of a series of techniques which are designed to find out the work content, of a particular task or activity, by ascertaining the actual amount of time necessary for a qualified worker, to perform the task, at a predetermined performance level. We can use to Work measurement system.
3.2 Materials used:
Required tools
- Stop watch
- Observation Sheet
- Time story board
- Time study Form
- Time reading machine
- Slide Ruler
- Measurement Tape
- Micrometer
- Motion Picture Equipment
- Pencil
- Eraser
- Item Information
3.3 Making Process of Garments:

3.4 Equations used for calculation:
Standard Pitch Time (S.P.T) = Basic Pitch Time (B.P.T) + Allowances (%)
…………..Total manpower per line x Total working minute per day
Target = —————————————————————————————– x 100%
………………………………………………………SAM
…………………………………………………..Target per hour
Theoretical Manpower = ————————————————-
…………………………………………..Process capacity per hour
……………………………………………Total number of output per day per line
Line Labor Productivity = ——————————————————————
……………………………………………………..Number of worker worked
……………………………………………….Total number of output per day per line
Line Machine Productivity = ————————————————————-
…………………………………………………………Number of machines used
………………………………..Total number of output per day per line x SAM
Line Efficiency = —————————————————————————- x 100%
………………………….Total manpower per line x Total working minutes per day
SMV = Standard Minute Value
= Basic Time + Allowance of Basic Time
= (Cycle Time × Rating of Operator) + Allowance of Basic Time
Factory Capacity = (60 ×Average SMV) × Total Direct Worker × Work Hour × Work Days × Efficiency (%)
……………………….Output
Productivity = —————– x 100
………………………..Input
…………………………….Total Production
Achievement (%) = ———————————-
………………………………..Total Target
………………………………………………….Required Manpower
Balancing Loss (%) = 100% − —————————————-
…………………………………………………Allocated Manpower
………………………………………………………………..BPT
Upper Control Limit (UCL) = ————————————–
…………………………………………………Expected Efficiency (%)
Lower Control Limit (LCL) = 2 × BPT
Capacity = 60 / Capacity time in minute
Cycle Time = 60 / Team target
Team target = (Work hour/SMV) * Present operator * Organizational efficiency
Capacity Achievable = Capacity * Balance
Balance = BPT / Bottle neck time (BNT)
Standard time = Net operation time * (1 + Ratio of loss time)
Daily output = Work hour / SMV
Factory capacity = (Work hour / SMV) * Total worker * Working day * Efficiency
CPM = (Total overhead cost of the month / No of SMV earners * Work minutes)
Required no of operator = Target daily output / Daily output per operator CM of garments = Total production / (No of worker * Work hour)
Marker Efficiency = (Total area of marker / Total area of lay) * 100
CPD = Consumption per dozen
CPD = Marker length * Marker width * GSM * 12 / (1000 * 100 * 100 * Total marker pace€™s)
CHAPTER-04
RESULT & DISCUSSION
4.1 Graphical Representation of SMV before Line Balancing:
In the above graph we can see the operation 19 and production per hours 204 pcs. Some operation give high production and some operation give low production. But we selected average equal point production in graphical diagram. Before Line Balancing Graph Some operation we are marking Different collar & Calculate SMV.

4.2 Graphical Representation of SMV after Line Balancing:
In the above graph we can see the operation 18 and production per hours 204 pcs. Some operation give high production and some operation give low production. But we selected average equal point production in graphical diagram. After Line Balancing Graph Some operation we are marking Different collar & Calculate SMV.

4.3 SMV Calculation (Before Line Balancing):
1. Shoulder Join: SMV = 28.2 + (28.2 x20%)
= 28.2 + 5.64
= 33.84/60
= 0.56
2. Neck Join: SMV = 17 + (17 x20%)
= 17 + 3.4
= 20.4/60
= 0.34
3. Sleeve join SMV = 39.6 + (39.6x 20%)
= 396 + 7.92
= 47.52/60
= 0.79
4. Sleeve raw finish Tack: SMV = 28 + (28 x20%)
= 28 +5.6
= 33.6/60
= 0.56
Total SMV in four process before line balancing = 2.25
4.4 SMV Calculation (After Line Balancing):
1. Shoulder Join: SMV = 24 + (24 x20%)
= 24+4
= 28/60
= 0.48
2. Neck Join: SMV = 8 (8 x20%)
= 8+ 1.6
= 9.6/60
= 0.16
3. Sleeve join: SMV = 17.2 + (17.2 x20%)
= 17.2 +3.44
= 20.64/60
= 0.34
4. Sleeve raw finish Tack: SMV = 14 + (14 x 20%)
= 14 + 2.8
= 16.8/60
= 0.28
Total SMV in four process is After line balancing = 1.26
4.5 Variation in each process before capacity per hour compare to bench mark target per hour:
Time study sheet is attached showing the different types of machine used, number of operators and helpers, basic and standard pitch time and capacity per hour.
Process wise capacity of each work station has been shown in Annexure 2 where standard allowable minutes (S.A.M) has been calculation by adding S.P.T of each process. Figure: 4.3 shows the target per hour for the line calculating total 37 manpower worked on that line for 600 minutes with a S.A.M value of 8.90. We have standardized the bench mark target of 200 pieces of garment at 80% efficiency. Observation before balancing the line has been reflected as labor and machine productivity is 32 and 55, line efficiency is 48%.
4.6 Variation in each process after capacity per hour compare to bench mark target per hour:
Changing from traditional layout to balanced layout model, there are considerable improvements have moved toward us. Among the three operators who were replaced to another line, have been used in the lock stitch and flat lock machines and machine productivity for these less used machines has been increased to 39 from 32.
In a day we have boost up the production up to 1250 and with manpower of 32, line efficiency has been improved from 48% to 58% which is shown in Figure: 4.4. In an improved layout, target has been decreased at each efficiency level. At 80% efficiency, target is now 173 pieces per hour which has been considered as new bench mark target.
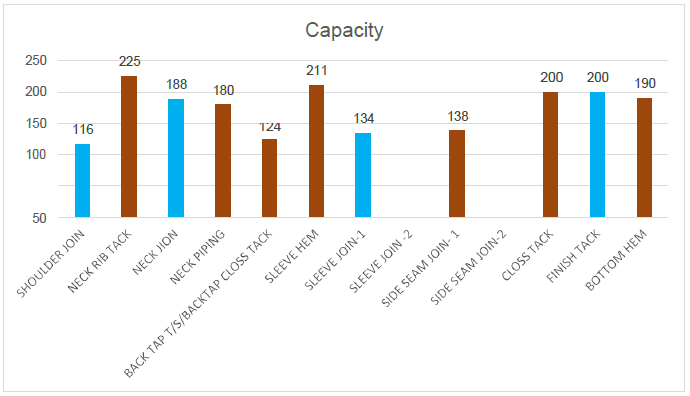
4.7 Capacity Calculation (Before Line Balancing):
…………………………..3600
Capacity = —————————————
………………..Average Cycle Time
1. Sleeve hem, Front & back part Matching, Shoulder Top stitch, Separate & shoulder Scissoring, Back Tape Piping & Separate, Front Neck Topstitch, Bottom hem, Bottom thread Cut = 3600/14.4 = 250
2. Sleeve Separate & Arrange = 3600/13.8 = 261
3. Care Label Make, Care Label Tack = 3600/12 = 300
4. Shoulder join = 3600/24 = 150
5. Sleeve Attach, Sleeve Opening Press Tack =3600/27.5 = 130
6. Neck Make = 3600/13.17 = 273
7. Neck Join, Back Tape Topstitch = 3600/21 = 171
8. Side Seam = 3600/42 = 86
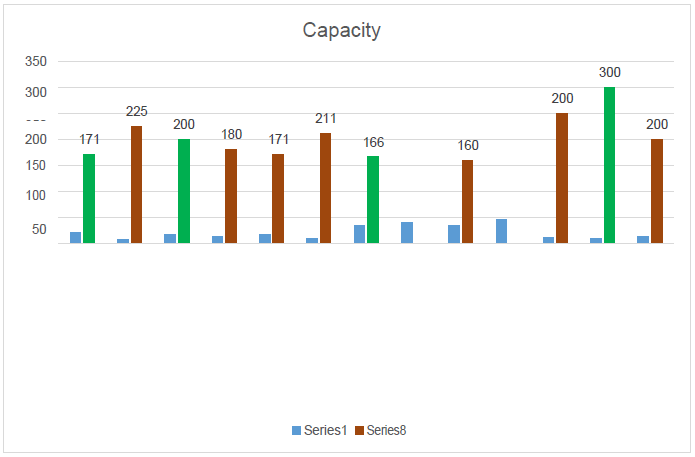
4.8 Capacity Calculation (After Line Balancing):
1. Sleeve hem, Front & back part Matching, Shoulder Topstitch, Separate & shoulder Scissoring, Back Tape Piping & Separate, Front Neck Topstitch, Bottom hem, Bottom thread Cut =3600/14.4 = 250
2. Sleeve Separate & Arrange= 3600/13.8 = 261
3. Care Label Tack= 3600/12 = 300
4. Shoulder join = 3600/24 = 150
5. Sleeve Attach, Sleeve Opening Press Tack =3600/27.5 = 130
6. Neck Make = 3600/13.17 = 273
7. Neck Join, Back Tape Topstitch = 3600/21 = 171
8. Side Seam = 3600/42 = 86
4.9 Production Efficiency Graph:

Here we see that the final output of after balancing is relatively very high then before balancing condition. Though the manpower, machine, SMV, Performance rating, individual efficiency are almost same but the final output is increased. It is just come in true for the cause of line balancing through changing or sharing the workstation. This is a manual process of the industry. There should be many process of line balancing. But it is the easiest process of line balancing to improve final output or production
4.10 Calculation of Production Efficiency:
Before:
…………………900 x 5.74
Efficiency = ——————— x 100
………………..21 x 8 x 60
= 0.5125 x 100
…..5166
= ————- × 100
….10080
= 51.25%
After:
………………..1350×5.54
Efficiency = ————————
…………………21×8×60
……5263
= ————- x 100
….10080
= 87%
4.11 Comparative study on SMV before and after line balancing:

CHAPTER-05
CONCLUSION
5.1 Conclusion:
A line balancing technique is developed for sewing line in garment industry. We’ve done this project to improve productivity through line balancing (Sharing & Changing workstation) in the sewing section. In our project, we are trying to show that line balancing is very important fact in garments section as well as sewing section. Overall productivity improvement depends on proper line balancing. During the working period of this project, we have seen that there is a huge change in production depending on line balancing. We worked at Paramount textile limited for this project. It is a 100% export oriented garments factory in our country that located at Gorgoriya Master Bari, Gilarchala, Sripur, Gazipur. So we are grateful to our supervisor. However from this project we gathered a vital experience about line balancing, SMV Calculation, Efficiency, manpower, machine, cycle time, time study, sewing line etc. It can be said that without arranging a proper line balancing on the sewing floor of a garments factory optimum productivity & efficiency cannot be gained. At last, the noticeable achievements of line balancing are-: improvement of productivity, Capacity smooth work flow, balanced cycle time, easy fault finding, reduced bottleneck, balanced line efficiency, reduction operation breakdown, equal distribution of work, skilled, semiskilled & unskilled co-ordination and easy way to supervise. As a result we are Finding Before line balancing total SMV 5 & After line balancing total SMV 4.
References
[1] Chen J.C., Chen C.C., Lin Y.J., Lin C.J., and Chen T.Y. Assembly Line Balancing problem of Sewing Lines in Garment Industry. International Conference on Industrial Engineering and Operations management, Bali, Indonesia, 2014.
[2] Eryuruk S.H., Clothing assembly line design using simulation and heuristic line balancing technique, Ege University Textile and Apparel Research & Application Center,2012.
[3] Eryuruk S.H, Klaoglu F. and Baskak M. Assembly line balancing in a Clothing Company. FIBRES & TEXTILE in Eastern Europe, 2008.
[4] Jithendrababu B. L., Renjukurian and Pradeepmon T.G. Balancing Labor Intensive Assembly line using genetic Algorithm. International Journal of Innovative Research in Science, Engineering and Technology,2013.
[5] Jaganathan V.P. Line balancing using largest candidate rule algorithm in a garment industry: a case study. International Journal of Lean Thinking,2014.
[6] Chan K.C.C, Hui P.C.L., Yung K.W., Ng F.S.F. (1998). Handling the assembly line balancing problem in the clothing industry using a genetic algorithm, International journal of Clothing Science and Technology, Vol.10, pp.21-37.
[7] Tyler D.J. (1991). Materials Management in Clothing Production, BSP Professional Books Press, London.
[8] Cookling G. (1991). Introduction to Clothing Manufacturing, Blackwell Science, Oxford, p.104.
[9] Chuter, A.J. (1988). Introduction to clothing production management, Blackwell Science, 1988. Oxford, pp.60-63.
LIST OF ABBREVIATIONS
| S.I No | Short Form | Abbreviations |
| 1 | GDP | Gross domestic product |
| 2 | RMG | Readymade Garments Industries |
| 3 | UCL | Upper control Limit |
| 4 | SPL | Standard pitch time |
| 5 | BPT | Basic Pitch Limit |
| 6 | SAM | System award management |
| 7 | SMV | Standard Minute Value |
| 8 | TMU | Textile Management Unit |
| 9 | GSD | General sewing Data |
| 10 | SPD | Sensory processing Disorder |
| 11 | PTS | Primary textile sector |
| 12 | CPM | Cost to the advertiser |
| 13 | BNT | Bottle Neck Time |
| 14 | GSM | Gram Square meter |
| 15 | DHU | Defects per hundred units |
| 16 | AML | Actual Minute Limit |
| 17 | LCL | Lower control Limit |
| 18 | IE | Industrial Engineering |
| 19 | PPM | Pre Production Meting |
You may also like:
- Study on Effect of Applying Industrial Engineering Tools in Sewing Section
- Module & Responsibility of Industrial Engineering Department for Apparel Production
- Improvement of Sewing Line Productivity by Using Work Study Method
- Method Study in Apparel Industry – A Systematic Approach
- Techniques and Applications of Work Measurement in Apparel Industry
- Benefits of Work Study in Garments Industry
- Industrial Engineering Formulas for Textile Students and Professionals
- Line Balancing and Bottleneck in Garment Production Line
- Time and Action Plan for Garment Merchandising
- Improving Productivity of Garment Industry with Line Balancing
Founder & Editor of Textile Learner. He is a Textile Consultant, Blogger & Entrepreneur. Mr. Kiron is working as a textile consultant in several local and international companies. He is also a contributor to Wikipedia.


