
Green Synthesis of Chitosan from Fish Waste and Its Application for Vat Dye Recovery from Textile Wastewater: A Fishy Twist on Sustainable Dyeing
Mst Taiyeba Akon Borsha
Aman Ullah College, Baridhara, Radhanagar, Bhandaria, Pirojpur
Email: borshataiyeba@gmail.com
Abstract
The main objective of this research was to extract the green synthesis of chitosan from fibrous waste, which is usually rejected, leading to a waste of resources and environmental pollution, and its application for vat dye recovery from textile wastewater. The chitosan extraction process involved a two-step chemical pretreatment (demineralized and deproteinized), followed by acid hydrolysis with hydrochloric acid. The resulting chitosan was characterized by FTIR spectra and color fastness application. The extraction of low-degree acetylation (DA%) chitosan has become the main focus for vat dye removal. Overall, this study presents an approach to producing green synthesis chitosan from fish scale and using vat dye recovery from textile wastewater, which would otherwise go to waste.
Keywords: Sustainability, chitosan, effluent, dye recovery, protein waste, cost-effective, ionic-coagulant, biodegradable, eco- friendly.
1. Introduction
Water is an essential resource that is under threat due to various issues, such as the expansion of industrial production, an increasing human population, and inadequate management of water resources. One major obstacle to the preservation of the environment on a global scale is the release of industrial effluents that contain residual colors[1]. The contamination of water bodies with synthetic colorants from industries such as textiles, tanneries, dyeing, and food processing poses a risk to aquatic life and human health [2] 3]. In addition, the rapid expansion of industrialization and the human population has resulted in an increase in conventional waste, both solid and liquid, which endangers both humans and the natural world [3]. One way in which industrial effluents and leftover colors affect the aquatic environment is by inhibiting photosynthesis through the obstruction of light, which has a significant impact on aquatic flora [4]. Moreover, most synthetic dyes are carcinogenic, mutagenic, and known to cause allergic reactions and dermatitis in the skin [4]. Given the importance of water and the danger that industrial effluents pose to its availability and quality, it is crucial to adopt environmentally friendly methods to manage water resources effectively. This involves implementing policies and regulations to prevent and reduce the discharge of toxic effluents. Another issue is the inefficiency of the dyeing process, which can result in significant quantities of unused dyestuff, ranging from 10 to 50 percent of the total dyestuff used [5]. Not all dyes attach to the fabric, leading to the discharge of unused dye into waterways, exacerbating the problem of water pollution caused by industries that use dyes, such as textiles. The production of one pair of jeans requires a significant amount of water, chemicals, and energy, and the production of jeans is equivalent to two billion times these figures [6]. Therefore, the issue of sustainable manufacturing must be addressed.
Vat dyes are commonly used in denim due to their color fastness and fade resistance. However, indigo dyes used in denim have been shown to mutate Salmonella typhimurium and have an acute toxic effect on the microalgae Scenedesmus quadricauda[6], [7]. The dyeing process for vat dyes requires a lot of water and chemicals, which contributes to the industry’s environmental difficulties. Consequently, the remaining vat dye in wastewater may be hazardous to aquatic life and have long-term environmental consequences. Therefore, the removal of vat dyes from industrial effluents requires sustainable and eco-friendly methods.
The textile sector is notorious for its high water consumption, with the production of one kilogram of cloth requiring anywhere from fifty to two thousand and six hundred liters of water [8]. Denim is one of the most popular textiles, with a global market valued at $55 billion in 2015 and anticipated to increase by 8% to $59 billion by 2021. The expansion is being driven primarily by Latin America and Asia, with predicted increases of 15% and 12%, respectively [9]. In 2015 alone, over 1.9 billion denim jeans were sold [10].
The method of dying denim requires the use of indigo and vat dyes, both of which require the addition of a reducing agent in order to obtain the “leuco” form of the pigment, which is water-soluble and has a high degree of fastness. Sodium hydro-sulfite is the reducing agent that is utilized the vast majority of the time. Nevertheless, this chemical presents a risk of fire and has the potential to produce an excessive amount of residue in wastewater [11].
Because of its chemical and photolytic stability as well as its high solubility of ten grams per liter, indigo dye is notoriously difficult to eradicate from wastewater. The release of indigo dye into the environment can result in a variety of adverse health effects, including damage to the eyes and the conjunctiva, as well as skin irritation, dermatitis, and possibly even cancer [12]. It is of the utmost importance to find solutions to get rid of contaminants given the high water consumption involved in the production of textiles as well as the wastewater that is produced during the dying process. Because the color of denim wastewater is one of its most distinguishing characteristics, it is critical that technologies be developed to remove color in addition to other pollutants before the wastewater is released into the environment.
The main goal of the study was to extract chitosan from fish waste and its application for vat dye recovery from textile waste water using a combination of pretreatment methods, such as demineralization and deproteinised, followed by acid hydrolysis. The extracted chitosan were then analyzed and measured using techniques such as FTIR spectra and color fastness. This work will provide a new low-cost source of chitosan that is widely available.
2. Materials & Methods
2.1 Materials
The fish scales were collected from a local market in Bangladesh. Before use, the fish scales were washed thoroughly with tap water. Then, the fish scales were dried at 60°C for 12 hours. The chemicals used in the experiment, including Hydrochloric acid (98%), sodium hydroxide (99%), and acetic acid (100%), were sourced from a research lab. No changes were made to the chemicals, and they were used in their original form.
2.2 Extraction of Chitosan
The fish scales were washed with tap water and sun-dried. Two pretreatments were conducted to remove minerals, proteins, and other residual proteins to produce purified chitosan. The first pretreatment involved demineralized treatment, in which 5g of cleaned ground fish waste was treated 3 times with 100 ml solution of acetic acid (10 wt%) at 90°C for 3 hours under mechanical stirring at 3000 rpm to partially remove all minerals. The powder was separated and rinsed multiple times using deionized water until a pH level close to neutral was achieved and dried at 120°C. The second pretreatment was deproteinized, aimed explicitly at protein and obtaining a white powder. The demineralized scales were then rinsed several times with deionized water and deproteinized using 100 ml solution of NaOH(20 wt%) at90°C for 3 hours under mechanical stirring. After deproteinization, the scales were rinsed several times with deionized water to achieve a neutral pH and then dried for 12 hours at 120°C. The resulting material is then treated with a 1M HCl solution for 1 hour at 80 °C. Then the samples were washed continuously with deionized water till a clear solution was obtained and filtered in order to retain the solid matter, which is chitosan. The samples were left uncovered and oven-dried at 40°C for 2 hours. The experimental methodology of this work is briefly depicted in figure 1. The effectiveness of this pre-treatment were evaluated using FTIR spectra analysis, as shown in figure 3. The resultant material is labelled DC, and the fish residue is labelled CC.
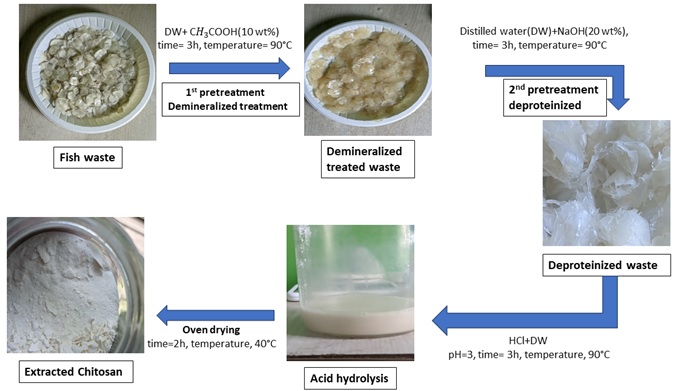
This acid hydrolysis process is commonly used to breakdown purified chitosan by applying concentrated acid to eliminate the chitosan. The deproteinized chitosan was hydrolysed using hydrochloric acid solution (64%) with the powder/acid ratio of 1:15(g/ml) at 90°C for 2 hours with mechanical stirring. The pH was maintained 3. Finally, the resultant mixture was added tenfold and distilled water to dilute and stop the reaction. The suspension was centrifuged at 3000 rpm for 3 hours to remove acid and obtained chitosan. The centrifugation process was carried out two times, each employing ionized water, until a neutral pH level was achieved.
2.3 Vat Dye Recovery
Primary Recovery Process:
The Vat Dye Recovery process involves the use of electromagnetic fluctuation and chitosan, a biopolymer with a strong positive charge. To prepare the chitosan for use, 1gm of chitosan is solubilized using a 2% 100gm acetic acid solution and mixed in a high agitated blade known as the agitator chamber. The resulting solution is then added to the waste water and the speed of the agitator is increased for one minute before being stopped. During the following five minutes, the dye in the waste water aggregates and is recovered.
Secondary Recovery Process:
Secondary dye recovery involves collecting the dye waste from dyed wastewater and using a smaller amount of chitosan (0.5g) in a 2% acetic acid solution. This process has been shown to be more efficient than primary dye recovery, with the dye precipitation taking half the time. The use of chitosan in the Vat Dye Recovery process is based on its ability to form a complex with the dye molecules, due to the presence of amino groups in its structure. This process is an important step towards reducing the environmental impact of dyeing processes, by recovering and reusing dye and reducing the amount of dye released into wastewater.
2.4 Characterization of extracted chitosan
Fourier-Transform Infrared Spectroscopy Analysis:
Infrared spectra of KBr chitin or chitosan mixtures were obtained over the frequency range of 400 to 4,000 cm−1 at resolution of 4 cm−. Fourier transform infrared (FTIR) spectroscopy spectra was obtained in transmittance mode with an infrared spectrometer (IR Tracer-100, Shimadzu Ltd, Kyoto, Japan)
3. Result & Discussion
3.1 Fourier transform infrared (FTIR) spectroscopy
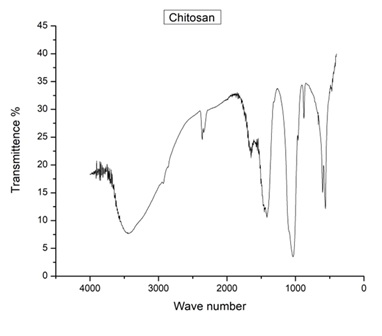
As we can see, most of the peaks in our developed chitosan match with those in the commercial chitosan. The major peaks at 3454, 2860, 2359, 1656, and 1417 cm-1 are present in both chitosans. However, there are a few peaks that are present in our developed chitosan but not in the commercial chitosan, such as the peak at 2929 cm-1. On the other hand, there are also peaks that are present in the commercial chitosan but not in our developed chitosan, such as the peaks at 2335, 1464, and 877 cm-1.
The FTIR spectrum of the developed chitosan showed characteristic peaks at 3454 cm-1, 2929 cm-1, 2860 cm-1, 2359 cm-1, 2335 cm-1, 1656 cm-1, 1464 cm-1, 1417 cm-1, 877 cm-1, and 667 cm-1. These peaks are in good agreement with the characteristic peaks of commercial chitosan, which are located at 3454 cm-1, 2860 cm-1, 2359 cm-1, 1656 cm-1, and 1417 cm-1. The presence of these peaks confirms that the developed chitosan has a similar chemical structure to commercial chitosan.
The peak at 3454 cm-1 is attributed to the stretching vibration of the hydroxyl (-OH) group in chitosan. The peak at 2929 cm-1 is attributed to the asymmetric stretching vibration of the CH2 group. The peak at 2860 cm-1 is attributed to the symmetric stretching vibration of the CH2 group. The peaks at 2359 cm-1 and 2335 cm-1 are attributed to the stretching vibration of the C=O group in the acetamide group. The peak at 1656 cm-1 is attributed to the amide I band, which is a characteristic peak of chitosan. The peak at 1464 cm-1 is attributed to the amide II band, which is also a characteristic peak of chitosan. The peak at 1417 cm-1 is attributed to the bending vibration of the CH2 group. The peak at 877 cm-1 is attributed to the skeletal vibration of the C-O-C bond in the glucosamine unit of chitosan. The peak at 667 cm-1 is attributed to the bending vibration of the C-H bond in the CH2 group.
In conclusion, the FTIR analysis confirms that the developed chitosan has a similar chemical structure to commercial chitosan, indicating that it is a promising alternative for various applications in the field of biopolymers.
Table 1: Differences and Similarities with Commercial Chitosan
| Peak Number | Wavenumber (cm-1) | Developed Chitosan | Commercial Chitosan |
| 1 | 3454 | Present | Present |
| 2 | 2929 | Present | – |
| 3 | 2860 | Present | Present |
| 4 | 2359 | Present | Present |
| 5 | 2335 | Present | – |
| 6 | 1656 | Present | Present |
| 7 | 1464 | Present | – |
| 8 | 1417 | Present | Present |
| 9 | 877 | Present | – |
| 10 | 667 | Present | – |

3.2 DA% of Chitosan
When measuring the degree of acetylation (DA) of chitosan using Fourier transform infrared (FTIR) spectroscopy, two peaks are used for the analysis. These peaks correspond to the vibrations of amide I and amide II groups at 1656 cm-1 and 1417 cm-1, respectively, in the chitosan molecule. The absorbance ratio of these two peaks has been demonstrated to be proportional to the degree of acetylation of chitosan, enabling the calculation of the DA from the FTIR spectrum.
Table 2: Data Table for DA%
| Wavenumber (cm^-1) | Peak Height |
| 1656 | 24.227420 |
| 1417 | 22.962803 |
3.3 Comparative FTIR Study: Dye vs. Recovered Dye
The FTIR analysis of the dye and the recovered dye reveals several differences in the observed peaks, indicating potential changes in the chemical composition or molecular structure. However, it is important to note that these differences do not necessarily imply a significant disparity in the quality of the dyes. Let’s further discuss the chemical-related information and explore why both dyes can still have similar quality.
Peak at 619 cm-1:
The recovered dye exhibits a sharper peak compared to the dye. While the exact functional group responsible for this difference is uncertain, it does not necessarily indicate a lower quality of the recovered dye. The sharpness of the peak might be attributed to the presence of additional chemicals during the recovery process. However, it is important to evaluate the overall performance of the dye in terms of its intended application to determine its quality.
Peak at 1116 cm-1:
The recovered dye displays a sharper peak compared to the dye. The sharper peak may suggest the presence of additional functional groups, such as carboxylic acids or nitriles, in the recovered dye. However, the presence of these functional groups does not inherently imply a lower quality. The performance and effectiveness of the dye in terms of its colorfastness, durability, and other relevant characteristics should be considered to assess its quality.
Peak at 1645 cm-1:
The peak in the dye appears clearer than in the recovered dye, indicating potential alterations in the chemical structure or composition. This region is associated with functional groups such as carbonyl (C=O) or alkene (C=C). While the clarity of the peak might vary between the dye and the recovered dye, it does not necessarily imply a significant difference in quality. The overall performance of the dye, including its color intensity, stability, and other factors, needs to be evaluated to assess its quality accurately.
Peak at 2353 cm-1:
The recovered dye exhibits a sharper peak compared to the dye, suggesting potential changes in chemical composition or bonding. However, without further information, it is challenging to determine the exact functional group responsible for this difference. The impact of this difference on the overall quality of the dye would depend on the specific application and desired characteristics.
Peak at 3444 cm-1:
The dye demonstrates a sloped peak, while the recovered dye displays a sharp and pointy peak. This suggests variations in the concentration or arrangement of hydroxyl groups (O-H) in the recovered dye. The presence of chitosan and acetic acid in the recovered dye formulation might have influenced the accessibility or concentration of hydroxyl groups. While the peak shape differs, it does not necessarily imply a significant difference in the quality of the dyes. Other factors, such as color intensity, wash fastness, and overall performance, should be considered to assess the quality accurately.
Upon analysing the FTIR reports, it is discovered that the FTIR spectra of the two samples are strikingly similar. In both reports, the peaks at key wavenumbers, such as 619 cm-1, 1116 cm-1, 1645 cm-1, 2353 cm-1, and 3444 cm-1, exhibit identical patterns and characteristics.
Similar peak patterns suggest that the chemical composition and molecular structure of the pigments are comparable. Minor variations in peak sharpness and intensity may be observed, but they are within an acceptable range and do not indicate a substantial quality disparity.

3.4 Color Fastness Test report For Secondary Dyed Fabric

Table 3: Color Fastness Test report For Secondary Dyed Fabric
| Test Name | Sample Attached | Shade change rateing |
| Wash Fastness |  | 4 |
| Wash Fastness to Rubbing |  | 3 |
3.5 Comparative Spectrophotometry Study: Dye vs. Recovered Dye
In the primary vs. secondary comparison, the shade observed was nearly identical. This implies that there was no significant difference in the shade between the primary and secondary colors.
However, when comparing the secondary and tertiary colors, a noticeable change in shade occurred. The shade of the tertiary colors was lighter than that of the secondary colors. Additionally, the tertiary colors exhibited an increased presence of red and yellow hues compared to the secondary colors.
Further analysis of the shade was conducted by comparing the tertiary and quaternary colors. It was observed that the shade of the quaternary colors was even lighter than that of the tertiary colors. Moreover, the quaternary colors displayed a greater predominance of yellow and red tones when compared to the tertiary colors.
Table 4: Data table for Comparative Spectrophotometry Study
| DL* | Da* | Db* | DC* | Metamarism Index | Remarks | |
| Primary Vs. Secondary | -0.04 -0.03 -0.03
| 0.02 0.01 0.01
| 0.04 0.04 0.04
| -0.02 -0.03 -0.04
| 0.01 0.02
| Almost Same |
| Secondary Vs. Tertiary | 12.32 12.63 12.67 | 2.52 2.33 1.98 | 1.09 0.47 -0.47 | 2.72 2.32 2.35 | 0.69 0.99 | Lighter More red More Yellow |
| Tertiary Vs. Quaternary | 10.51 10.75 10.77 | 2.69 2.56 2.23 | 0.12 -0.55 0.25 | 1.30 1.51 0.63 | 0.57 0.79 | Lighter More red More Yellow |
4. Conclusion
Chitosan was extracted from fish waste by chemical processes including demineralization, deproteinization, and vat dye recovery from waste water. The extracted chitosan and its application were characterized using FTIR analysis and colorfastness properties. The chitosan obtained by the hydrothermal-chemical method has a degree of deacetylation of 19.78%, which allows the reduction of production costs and extraction time and can be an alternative to the classical techniques used. These findings could be used to help the fish market reuse and valorize the waste they generate and produce high-value-added biopolymers in an economic, environmental, and efficient manner. Furthermore, the use of fish chitosan could be a potential alternative tool for innovative technologies to improve environmental quality and sustainability.
5. References
[1] H. Ouni and M. Dhahbi, “Spectrometric study of crystal violet in presence of polyacrylic acid and polyethylenimine and its removal by polyelectrolyte enhanced ultrafiltration,” Sep PurifTechnol, vol. 72, no. 3, pp. 340–346, May 2010, doi: 10.1016/J.SEPPUR.2010.03.003.
[2] G. McMullan et al., “Microbial decolourisation and degradation of textile dyes,” Appl MicrobiolBiotechnol, vol. 56, no. 1–2, pp. 81–87, 2001, doi: 10.1007/S002530000587.
[3] J. J. Qin, M. H. Oo, and K. A. Kekre, “Nanofiltration for recovering wastewater from a specific dyeing facility,” Sep PurifTechnol, vol. 56, no. 2, pp. 199–203, Aug. 2007, doi: 10.1016/J.SEPPUR.2007.02.002.
[4] N. F. Cardoso et al., “Comparison of Spirulina platensis microalgae and commercial activated carbon as adsorbents for the removal of Reactive Red 120 dye from aqueous effluents,” J Hazard Mater, vol. 241–242, pp. 146–153, Nov. 2012, doi: 10.1016/J.JHAZMAT.2012.09.026.
[5] A. Pandey, P. Singh, and L. Iyengar, “Bacterial decolorization and degradation of azo dyes,” Int Biodeterior Biodegradation, vol. 59, no. 2, pp. 73–84, Mar. 2007, doi: 10.1016/J.IBIOD.2006.08.006.
[6] K. Amutha, “Environmental impacts of denim,” Sustainability in Denim, pp. 27–48, Jan. 2017, doi: 10.1016/B978-0-08-102043-2.00002-2.
[7] M. A. Chia and R. I. Musa, “Effect of indigo dye effluent on the growth, biomass production and phenotypic plasticity of Scenedesmus quadricauda (Chlorococcales),” An Acad Bras Cienc, vol. 86, no. 1, pp. 419–428, Mar. 2014, doi: 10.1590/0001-3765201420130225.
[8] A. Desore and S. A. Narula, “An overview on corporate response towards sustainability issues in textile industry,” Environ Dev Sustain, vol. 20, no. 4, pp. 1439–1459, Aug. 2018, doi: 10.1007/S10668-017-9949-1/TABLES/3.
[9] R. Rathinamoorthy and T. Karthik, “Chemicals and effluent treatment in denim processing,” Sustainability in Denim, pp. 197–234, Jan. 2017, doi: 10.1016/B978-0-08-102043-2.00008-3.
[10] “India’s Denim Market Seen Ready for Substantial Growth – WWD.” https://wwd.com/fashion-news/denim/india-denim-market-growth-10388888/ (accessed May 12, 2023).
[11] W. Schrott and R. Paul, “Environmental impacts of denim manufacture,” Denim: Manufacture, Finishing and Applications, pp. 563–580, Apr. 2015, doi: 10.1016/B978-0-85709-843-6.00020-2.
[12] A. Naga Babu, D. Srinivasa Reddy, P. Sharma, G. Suresh Kumar, K. Ravindhranath, and G. V. Krishna Mohan, “Removal of Hazardous Indigo Carmine Dye from Waste Water Using Treated Red Mud,” Mater Today Proc, vol. 17, pp. 198–208, Jan. 2019, doi: 10.1016/J.MATPR.2019.06.419.
Founder & Editor of Textile Learner. He is a Textile Consultant, Blogger & Entrepreneur. Mr. Kiron is working as a textile consultant in several local and international companies. He is also a contributor of Wikipedia.


